Constructed Analogue (CA) Prediction of the Tropical Pacific SST and the Entire World Ocean for the remainder of 2002 and early 2003
(Sept 2002)
contributed by Huug van den Dool
Climate Prediction Center, NOAA, Camp Springs, Maryland
Because natural analogues are highly unlikely to occur in high degree-of-freedom processes, we may benefit from constructing an analogue having greater similarity than the best natural analogue. As described in Van den Dool (1994), the construction is a linear combination of past observed anomaly patterns in the predictor fields such that the combination is as close as desired to the initial state (or 'base'). We use as our predictor (the analogue selection criterion) the first 5 EOFs of the global SST field at four consecutive 3-month periods prior to forecast time. For the most recent season we use 10 EOFs. Data extending from 1955 to the present are used for a priori skill evaluation.
For a given base time (previous ones extending back to 1956, or the current real time forecast ending with JAS2002), a linear combination is made of the global SST (truncated to 5 or 10 EOFs) observed in all years (1956-2000) excluding the base year, so as to match the SST pattern of the base time. This is done using multiple ridge regression, with each year's SST state as a predictor to which a weight is assigned, determined by inverting the 45 X 45 (available years) covariance matrix. Here, we wish to forecast the future SST anomaly in the Niño 3.4 region (5N-5S, 120-170W) of the tropical Pacific. The CA weights are thus applied to the subsequently occurring Niño 3.4 SST in the predictand period for these years past, forming the forecast for the base year's predictand period. Note that the predictand is not involved in the construction process. The constructed analogue is the same linear combination for all leads, i.e the weights are persisted, and can be applied to any predictands other than Nino3.4.
Additional detail about the constructed analogue method (Van den Dool 1994) shows that constructed analogues usually outperform natural analogues (such as they are) in specification mode (i.e. "forecasting" one meteorological variable from another, contemporaneously). This advantage may also be expected to occur in real forecasting, as long as the (linear) construction does not compromise the physics of the system too much. A constructed analogue yields a single linear operator derived from data by which the system can be propagated forward in time. This is methodologically related to POP and linear inverse modelling, except that the CA forecasts may contain growing modes. The skill of the constructed analogue method in forecasting SST is discussed in Van den Dool and Barnston (1995), and kept up to date.
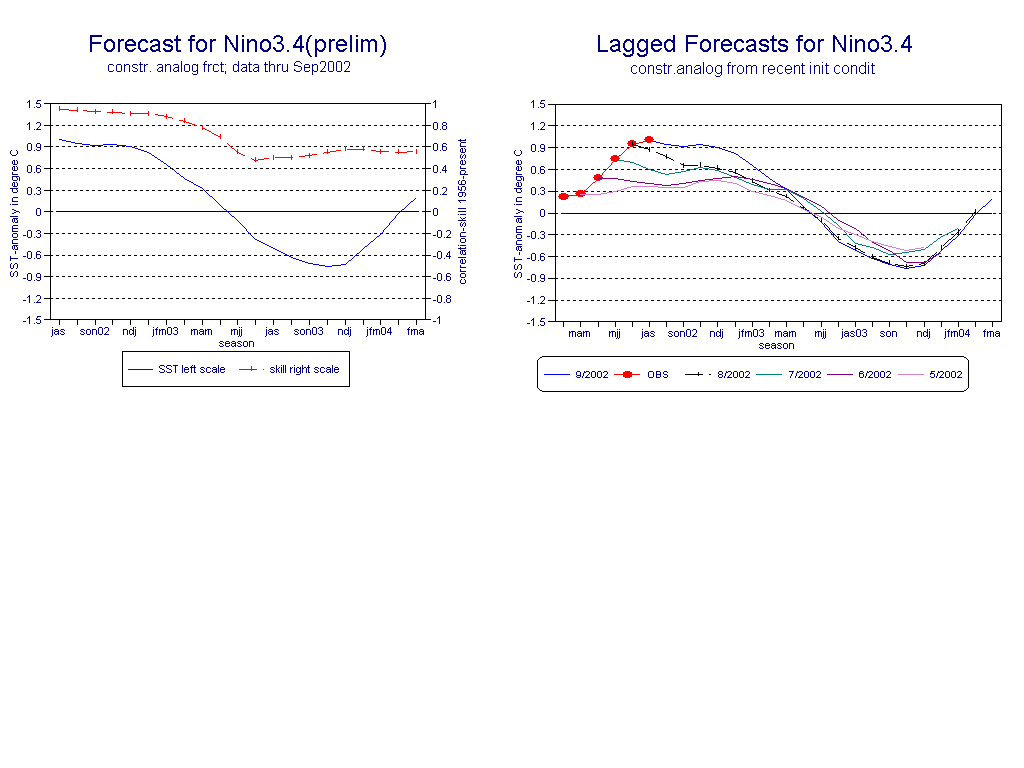
The current constructed analogue forecasts for Niño 3.4 out to 1.5 years lead are shown on the left in Fig. 1 or ftp://ftpprd.ncep.noaa.gov/pub/cpc/wd51hd/sst/200209/sst1.gif using data through JAS 2002. The expected cross-validated skill is also shown (dashed;right-hand scale of Figure on the left). The SST anomaly observed during JAS 2002 is plotted as the earliest "forecast" value. For the early leads the observed SST for JAS enters into the plotted forecast for ASO and SON 2002 with a 2/3 and 1/3 weight, respectively, providing continuity with the known initial condition. Fig.1 on the right shows forecasts from the last 5 initial conditions, back to 4 months ago - the red dots are the recent seasonal mean obs from which these lagged forecast depart.
A closer look at the skill of the constructed analogue method was provided by Fig. 2 in the June 1996 issue of this Bulletin (p. 73). Forecasts for late fall through winter tend to be most skillful, while summer forecasts have lower skill. While skill (dashed line in Fig. 1) generally decreases with lead time, the dependence on the target season is sometimes a stronger factor, causing what seems a 'return of skill' with increasing lead. At this point in the annual cycle skill is 0.7 or better thru early 2003 and drops only after the next spring barrier.
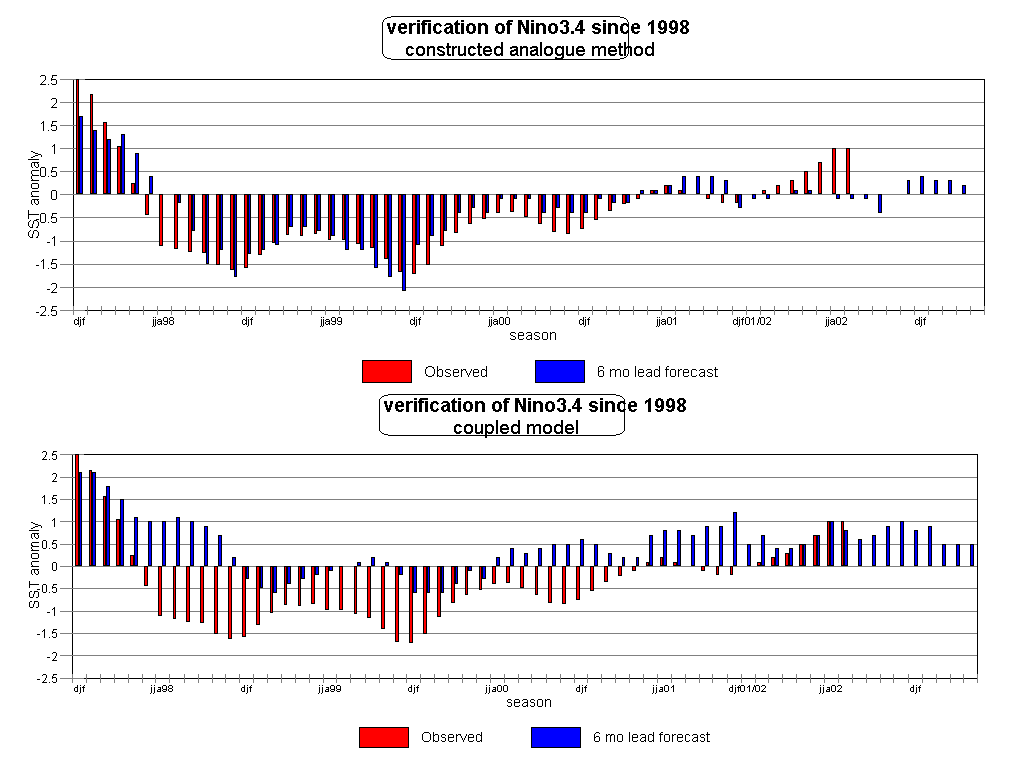
Skill averaged over 1956-present had gone up considerably with the addition of the 97/98/99/00/01 warm/cold events added to the verification sample. The skill of CA is, on average, competitive with (if not better than) other empirical as well as dynamical methods (Barnston et al. 1994). An evaluation over 1996-98 (Barnston et al 1999, Landsea and Knaff 2000) shows CA, CCA and CLIPER to be the clear frontrunners among the empirical methods and continuing to be competitive with dynamical methods, such as the NCEP and COLA models. Recent verification can be seen in Fig 2 or ftp://ftpprd.ncep.noaa.gov/pub/cpc/wd51hd/sst/sstcacmp.gif). CA appears to have done very well on the 3 year cold event (98-01). On the current warm event that started in spring 2002 CA has done only a mediocre job, certainly at the 6 month lead time.
NINO3.4 anomaly values were near zero since spring 2001, but have become noticeably positive since May 2002. Currently Nino34 is around +1.0C relative to the normal. CA forecasts Nino3.4 seasonal mean anomalies are close to values of 1.0 thru the remainder of 2002. This is a forecast for a weak to moderate warm event.
Years with large +ve weights (>0.15) are 1970, 1990, 1991 and 2000. 1989 and 1998 are years with high -ve weight. Other years have smaller weight and only a few years have zero weight. Indeed this is a constructed analogue, not a natural analogue. While the ENSO situation definitely enters into the analogue selection, non-ENSO (remember, global SST EOFs are used - the CA knows nothing specifically about NINO3.4) Processes other than ENSO also determine the weights and, thus, the resulting forecast. Weights in Table 1 have a clear upward trend, suggesting interdecadal variability or climate change.
All anomalies now refer to the 1971-2000 base period!
( All forecasts (Global!) from Initial Conditions in March 2000, to the present can be accessed at ftp://ftpprd.ncep.noaa.gov/pub/cpc/wd51hd/index.html then click on SST CA and the initial condition of your choice, currently Sept 2002 is the latest.)
Verification can be found for 1998-present at ftp://ftpprd.ncep.noaa.gov/pub/cpc/wd51hd/sst/sstcacmp.gif (CA & Coupled Model) and ftp://ftpprd.ncep.noaa.gov/pub/cpc/wd51hd/sst/sstccacon.gif (CCA & Consolidation) A numerical version of all forecasts, back to 1956, can be found at ftp://ftpprd.ncep.noaa.gov/pub/cpc/wd51hd/sst/cahistory_anomaly , the earlier years were derived under cross-validation.
References:
Barnston, A.G., H.M. van den Dool, S.E. Zebiak, T.P. Barnett, M. Ji, D.R. Rodenhuis, M.A. Cane, A. Leetmaa, N.E. Graham, C.F. Ropelewski, V.E. Kousky, E.A. O'Lenic and R.E. Livezey, 1994: Long-lead seasonal forecasts--Where do we stand? Bull. Amer. Meteor. Soc., 75, 2097-2114.
Barnston, A. G., M. H. Glantz and Yuxiang He, 1999: Predictive skill of statistical and dynamical climate models in SST forecasts during the 1997/98 El Nino episode and the 1998 La Nina onset. Bull. Amer. Meteor. Soc., 80, 217-243.
Landsea, Christopher W., John A. Knaff, 2000: How Much Skill Was There in Forecasting the Very Strong 1997-98 El Niño?. Bulletin of the American Meteorological Society: Vol. 81, No. 9, pp. 2107-2120.
van den Dool, H.M., 1994: Searching for analogues, how long must we wait? Tellus, 46A, 314-324.
van den Dool, H.M. and A.G. Barnston, 1995: Forecasts of global sea surface temperature out to a year using the constructed analogue method. Proceed-ings of the 19th Annual Climate Diagnostics Workshop, Nov. 14-18, 1994, College Park, Maryland, 416-419.
Figure Captions:
Table 1. Inner products (IP; scaled such that sum of absolute values is 100) and weights (Wgt multiplied by 100.) of each of the years to construct an analogue to the sequence of 12 consecutive
overlapping 3-month periods defined as the base (currently the string ASO2001 thru JAS2002). Years are labeled by the mid-month of the most recent predictor season. 2001 is not yet used as a
candidate analogue because long lead forecasts would not be possible beyond the latest observations. Data currently thru Sept 2002 (preliminary).
| Year | IP | Wgt | Year | IP | Wgt | Year | IP | Wgt | Year | IP | Wgt | Year | IP | Wgt |
| 1956 | -2 | -5 | 1966 | -3 | -4 | 1976 | -2 | -9 | 1986 | -1 | -6 | 1996 | 4 | 10 |
| 1957 | 1 | 5 | 1967 | -2 | -5 | 1977 | -3 | 5 | 1987 | 1 | 11 | 1997 | 3 | 13 |
| 1958 | 0 | -1 | 1968 | -2 | -8 | 1978 | -7 | -12 | 1988 | 0 | 3 | 1998 | 0 | -16 |
| 1959 | -2 | -8 | 1969 | 2 | 12 | 1979 | -4 | -6 | 1989 | 0 | -16 | 1999 | 2 | 9 |
| 1960 | -4 | -10 | 1970 | 0 | 18 | 1980 | 0 | -3 | 1990 | 9 | 16 | 2000 | 4 | 21 |
| 1961 | 0 | 1 | 1971 | -2 | 3 | 1981 | -5 | -8 | 1991 | 6 | 24 | 2001 | NA | NA |
| 1962 | -1 | 3 | 1972 | 0 | 7 | 1982 | 2 | 1 | 1992 | 1 | 12 | |||
| 1963 | 1 | 4 | 1973 | -1 | 7 | 1983 | -1 | -13 | 1993 | -3 | -16 | |||
| 1964 | -3 | -3 | 1974 | -2 | -8 | 1984 | -1 | 4 | 1994 | -3 | -17 | |||
| 1965 | -2 | -5 | 1975 | -4 | -10 | 1985 | -3 | -9 | 1995 | 2 | 5 |
Fig. 1 - left. Time series of constructed analogue forecasts (solid blue line) for Niño 3.4 SST based on the sequence of four consecutive 3-month periods ending in Sept 2002. The red dashed line indicates the expected skill (correlation) based on historical performance for 1956- present. The x-axis represents the target period. The left y-axis (blue solid line) shows the SST forecast; the right y-axis (thin dashed red line) shows the skill. The observation is shown instead of the constructed analogue specification for the initial state JAS 2002, and this observation also contributes by decreasing amounts to the ASO and SON2002 plotted values (see text).
Fig.1 - right. Nino3.4 forecasts made by constructed analogue method from initial conditions over the last 5 months. The solid blue is the same as shown on the left. The thin red line connecting red dots are the obs for the last 6 months.
Fig.2 Recent verification. Shown as bars are 6 month lead forecasts (blue) and verifying observations (red) from 1998 onward. A 6 month lead means that, for example, the DJF forecast is made with data thru previous May. Anomalies wrt 1971-2000. Skill has been satisfactory for CA method over the last several years.