<!doctype html public "-//w3c//dtd
html 4.0 transitional//en">EXPERIMENTAL FORECAST OF EAST AFRICAN RAINFALL FOR
OCTOBER-DECEMBER 2002
by Andrew
Colman
Seasonal
Forecasting Group, Ocean Applications, Met Office, Bracknell, UK
INTRODUCTION
The Met Office is
conducting research into the effects of sea surface temperatures and other
climatic variables on tropical rainfall. As part of this research, experimental
seasonal rainfall forecasts have been made for the Sahel and adjacent regions
in tropical NW Africa since 1986, and for the Nordeste region of Brazil since
1987. Using similar statistical methods, forecasts for tropical East Africa
October-December rainfall (the 'short rains') have been issued since 1994 and
appear in previous September issues of this bulletin .
A long-lead forecast for East African rainfall using
observed data up to mid August has already been produced and was contributed to
the Greater Horn of Africa Climate Outlook Forum (GHACOF10 ). This forecast
uses observed data up to the end of August.
The region covered by the East Africa prediction is
between 5N and 15S and between 30E and the Indian Ocean coast. These forecasts
for E Africa were produced using statistical methods and by using the Met
Office's Atmospheric General Circulation Model (AGCM). In addition to forecasts
for the entire region, forecasts for 2.5o latitude x 3.75 o
longitude rectangular sub-regions corresponding to model grid boxes are
provided. Skill is not so high at this higher resolution but these forecasts
give an indication of rainfall distribution.
The statistical forecast is made by using linear
regression and discriminant analysis techniques, with three indices of global
sea surface temperature (SST) anomaly patterns (Appendix, figures A1-A3
respectively). The forecast model is derived from historical rainfall and SST
information.
The AGCM forecast was extracted from two nine-member
ensembles of AGCM predictions using sea temperatures and atmospheric conditions
observed just prior to when the forecasts were run (September 6th
and 13th).
Forecasts are expressed as probabilities for 5
equi-probable categories (quints) for the whole region and as probabilities of
3 equi-probable categories (terciles) for the sub-regions. The categories are equi-probable over the 1961-1990
climatology period.
The category
boundaries (as percentages of mean rainfall) are:
|
VeryDry/Dry
|
Dry/Average
|
Average/Wet
|
Wet /Very Wet
|
|
74%
|
86%
|
102%
|
124%
|
FORECAST SKILL
PERFORMANCE OF TRIAL FORECASTS FOR 50 PAST YEARS
The statistical and dynamical forecasts were tested
using trial forecasts over the period 1948 to 1997. The assessment measure used
is correlation.
Statistical linear regression forecasts were assessed
using a method where a trial forecast is made for each year using a regression
equation calculated using data for the remaining years. This assessment
provides a good measure of forecast skill from minimal data.
To provide an
indication of AGCM skill, the performance of a long term AGCM run forced with
observed SST in simulating rainfall is measured.
Statistical forecast skill correlation=0.50
AGCM simulation skill correlation=0.65
These correlations are statistically significant at
the 5% level.
PERFORMANCE OF REAL TIME EMPIRICAL
FORECASTS
Forecasts
have been made for this region since 1994. The forecasts for 1994 and 1995 were
strongly influenced by above and below average SST in the NW Pacific
respectively and the forecasts for 1997 and 1998 where influenced by the 1997
El Nino and the 1998 La Nina events. The observed rainfalls for 2000 and 2001
were quite close to the dry-average and very dry-dry boundaries respectively so
the forecasts for these seasons were as accurate as they could be.
|
Year
|
1994
|
1995
|
1996
|
1997
|
1998
|
1999
|
2000
|
2001
|
|
Forecast
Category
|
Very Wet
|
Dry
|
Average
|
Wet
|
Dry or
Average
|
Dry
|
Dry or Average
|
Dry or VeryDry
|
|
Observed
Category
|
Wet
|
Dry
|
Very Dry
|
Very Wet
|
Very Dry
|
Average
|
Dry
|
Very Dry
|
Note: The categories used for the 1994-1998 forecasts
are based on a 1951-1980 climatology. For the 1999 and later forecasts,
categories based on the 1961-1990 climatology are used as 1961-1990 is the
accepted WMO standard climatology period and is used by most forecasters. The
1961-1990 rainfall average is 104% of the 1951-1980 average.
FORECASTS
FOR THE 2002 SEASON
STATISTICAL FORECAST
Below average SST in the NW Pacific and in the
tropical SW Atlantic are favouring below average rainfall in E Africa this
year. The regression forecast is 96%
of the 1961-1990 average and is in the AVERAGE
category
The
discriminant analysis technique gives the following probabilities for the 5
(1961-1990 based) categories:
|
Very
Dry
|
Dry
|
Average
|
Wet
|
Very Wet
|
|
0.23
|
0.28
|
0.39
|
0.04
|
0.05
|
AGCM DYNAMICAL FORECAST
Based
on the performance of AGCM ensemble simulations of rainfall from 1961 to 1990,
the AGCM ensemble forecast is presented as probabilities of 5 (1961-1990 based)
observed rainfall categories which are:
|
Very
Dry
|
Dry
|
Average
|
Wet
|
Very Wet
|
|
0.42
|
0.24
|
0.15
|
0.08
|
0.10
|
OVERALL BEST ESTIMATE: This
year, the AGCM is favouring the VERY DRY category whilst the empirical
forecasts favour the AVERAGE category with probabilities skewed towards the
drier categories. Our best estimate is a consensus forecast for the DRY
category.
SUB- REGION GRID BOX FORECASTS
The grid box
forecasts are expressed as probabilities of terciles which are climatologically
equi-probable over 1961-1990. This is in order to make the forecasts compatible
with GHACOF forecasts which are expressed in the same way. Figure 1 shows the
skill of the empirical forecasts. The empirical and dynamical forecasts are
shown in figures 2 and 3 respectively.
Two forecast maps are shown for each category, one
includes all grid boxes for which there is data, the second (skill mask)
version includes only gridboxes where independent test correlation skill is
significant. To be included on the skill mask map, hindcasts for the box must
pass at least 1 of these 2 tests:
·
Correlation
between independent hindcasts and observations over 1949-1998 are significant
at the 5% level (shown in figure 1)
·
Correlation
between independent hindcasts of this years forecast tercile and observations
during 1949-1998 are significant at the 5% level
OVERALL BEST ESTIMATE: Below average rainfall is predicted for most
of Tanzania and Southern Kenya by both the AGCM and empirical forecasts.
Elsewhere, probabilities are mostly close to climatology levels. In the far
north-east (Central Sudan) the forecasts of below average rainfall mostly
indicate zero rainfall in a region where the climatology is zero rainfall .
REFERENCE:
Mutai, C.C., Ward, M.N and Colman, A.W.
Prediction of East Africa seasonal "short rainfall" rooted in
evidence for widespread SST-forced variability during October-December. J.Climatol.,
18, 975-997 (1998).
ACKNOWLEDGEMENTS:
Thanks to David Rowell for providing output from the
HADAM3 model. Thanks to Pete Mclean and
Richard Graham for supplying dynamical forecast output.
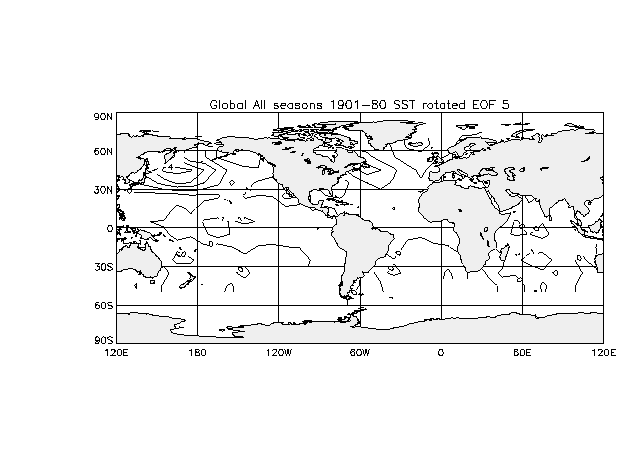
APPENDIX : Predictor patterns used for empirical Forecast
The pattern shown
in figure 3 is the most important predictor contributing to over 50% of the
forecast variance.
FIGURE 1:
CORRELATION SKILL OF EMPIRICAL REGRESSION FORECASTS
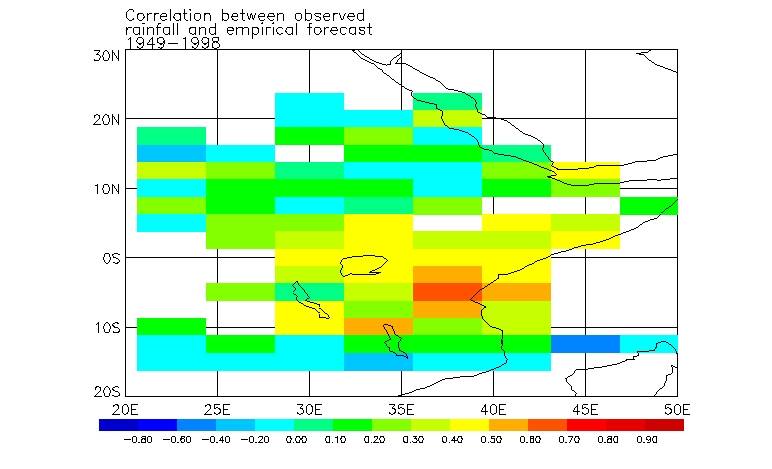
FIGURE 2: PROBABILITY FORECASTS BY
EMPIRICAL METHOD

FIGURE 3: PROBABILITY FORECASTS FROM AGCM DYNAMICAL
FORECAST

.
Figure A1:

Figure A2:

Figure A3: